If you’re looking for a sales dashboard, you’re looking for answers — trying to develop a better understanding of how your sales processes and people function, and how they can do better.
A dashboard is a great place to start, because it provides a visual, real-time overview of the most important metrics to your business. But a “sales dashboard” isn’t a thing you can just buy and build online, no strings attached. Dashboards are almost always part of a larger enterprise system — whether that be a business intelligence app that specializes in data visualization, or a CRM platform with embedded analytics.
ALSO READ: 4 Sales Prospecting Tools That Accelerate Lead Discovery and Qualification
Although terms like “big data” and “business intelligence” can seem intimidating to a line-of-business user, the market has turned out plenty of solutions in recent years that cost less, are easier to implement, and appeal to non-IT experts. The benefits of increased visibility and data-driven decision-making are hard to deny:
According to a 2015 study by Aberdeen, businesses that deploy sales analytics solutions are 93 percent “better at walking away from bad deals,” 33 percent better at discerning close probability, and 27 percent better at doubling down on high-stakes deals. They also create sales forecasts that are almost 10 percent more accurate at every stage of the funnel.
In this post, we’ll walk you through some of the most commonly used sales dashboards by looking at examples from leading software vendors. This overview should give you a better idea of not only how to apply analytics to your sales workflows, but which specific products might meet your needs.
CRM Software
CRM software is the workhorse of almost every B2B sales department — a place to store contacts, accounts, leads, and track deals as they progress. But a CRM can also be a powerful analytical tool. Many platforms include built-in reporting features that help managers keep an eye on revenue goals and productivity, and help individual reps hit their quotas.
Before you go out and buy (or subscribe to) a dedicated business intelligence tool, take a look at the CRM you already own, or the one you plan to implement. Does it offer embedded analytics? Can you create custom sales dashboards and reports?
Salesforce – Salesperson Dashboard
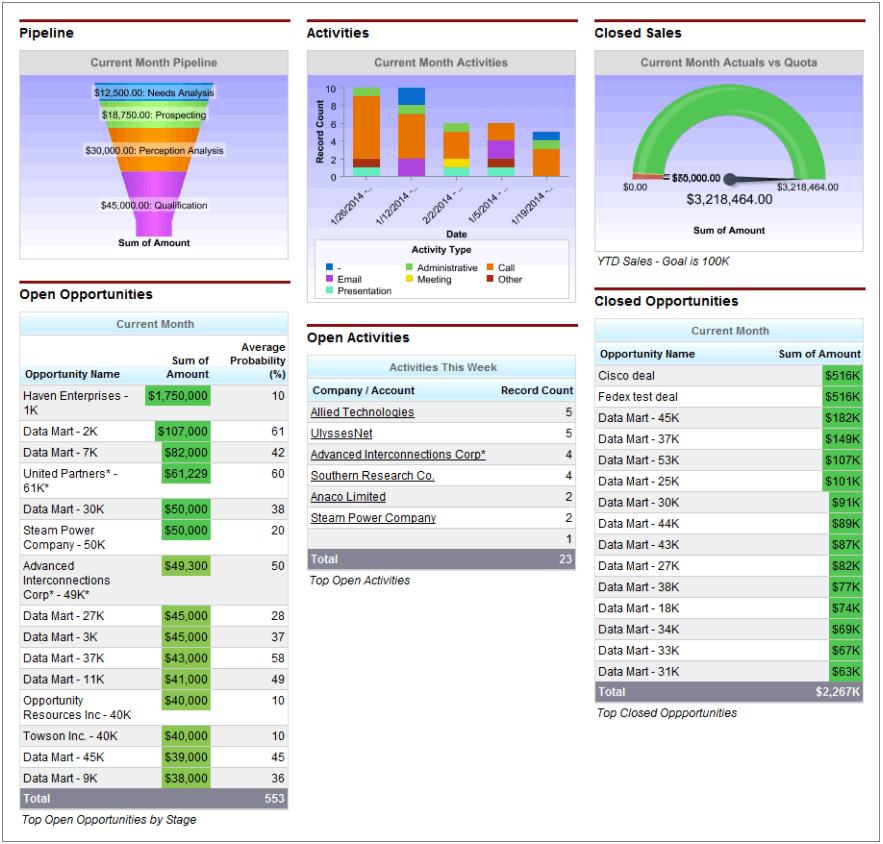
Salesforce is the global market leader for CRM software, so it’s no surprise that their platform offers some of the most powerful and versatile sales analytics in the industry. And if the built-in analytics aren’t enough for your needs, Salesforce offers Wave Analytics, a dedicated BI engine built on the same platform.
The dashboard above is part of their Sales Cloud solution, designed to help individual reps track their performance against quota. As you can see, it provides a nice overview of activities, open opportunities, and closed deals, with a gauge chart to represent actuals vs. quota. Administrators can configure the scope and values depicted on this dashboard and even set drill-down options to control what users see when they click on a given component. For example, clicking on a record detail under activities might send the salesperson to an account detail page.
Business Intelligence Software
If your sales unit (with the help of IT) decides to implement more advanced analytics, you’ll probably be looking at some kind of dedicated business intelligence tool. Business intelligence tools use a combination of in-memory and in-database processing to analyze massive amounts of data from many different sources. The advantage here is obvious: businesses can draw insight from all of their different departments and workflows (sales, marketing, service) in one place.
GoodData – Executive Dashboard
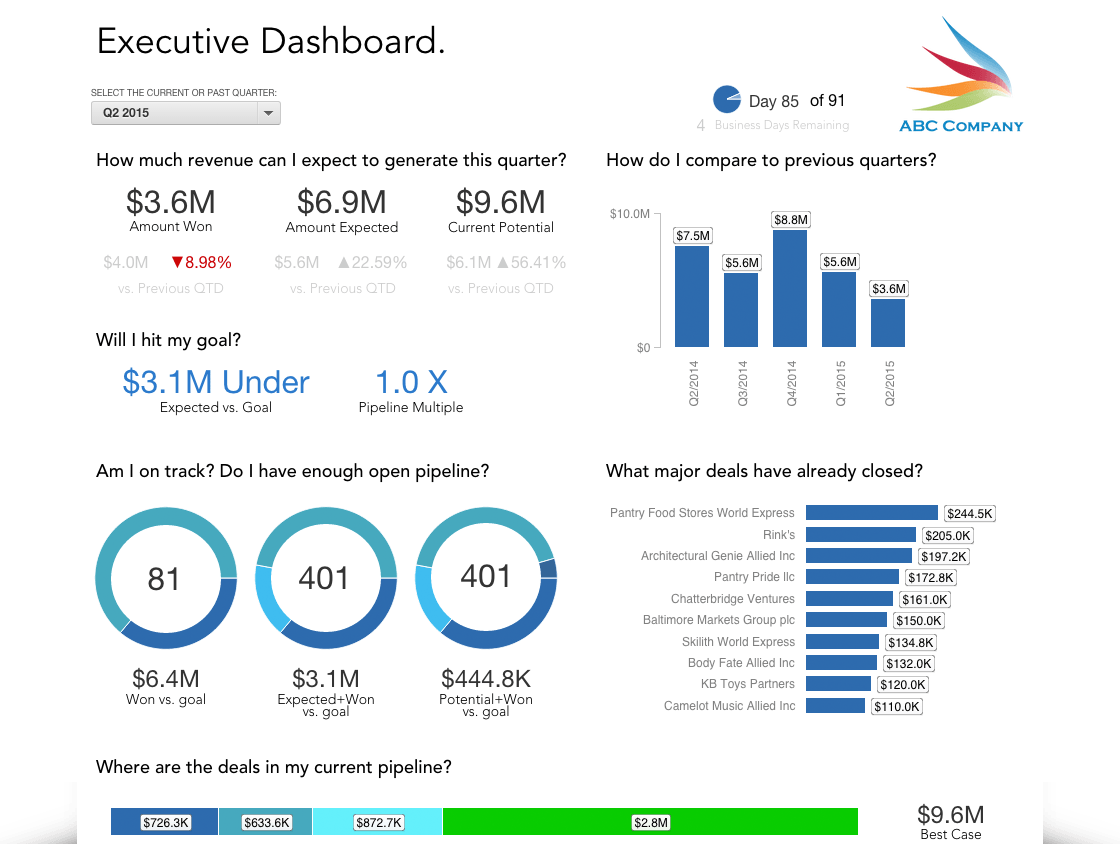
GoodData was founded in 2007 and now, with 30,000+ customers, is one of the biggest BI vendors on the market. They provide standalone products for financial services, retail, travel and hospitality, healthcare, media, and restaurants, as well as embedded analytics solutions for vendors that want to add dashboards to their existing products.
The executive sales dashboard above is a great example of how GoodData balances processing power with a clean interface and a simple user experience. I.e. you won’t need an IT certification just to crunch your numbers. Sales managers and execs can use this particular dashboard to see revenue won per quarter over revenue expected, historical trends, progress to goal, pipeline status and value, and a list of the latest closed deals.
Best-of-Breed Sales Tools
Outside of the major categories, there are an infinite number of peripheral tools designed to help salespeople and sales managers excel at more specific functions of their jobs — i.e. automated follow-ups, prospecting, price quoting, etc. As is the trend with modern SaaS products, many of these solutions offer their own reporting and analytical features, including real-time sales dashboards.
Let’s take a look at two examples:
InsightSquared – Sales Manager: Team Performance Dashboard
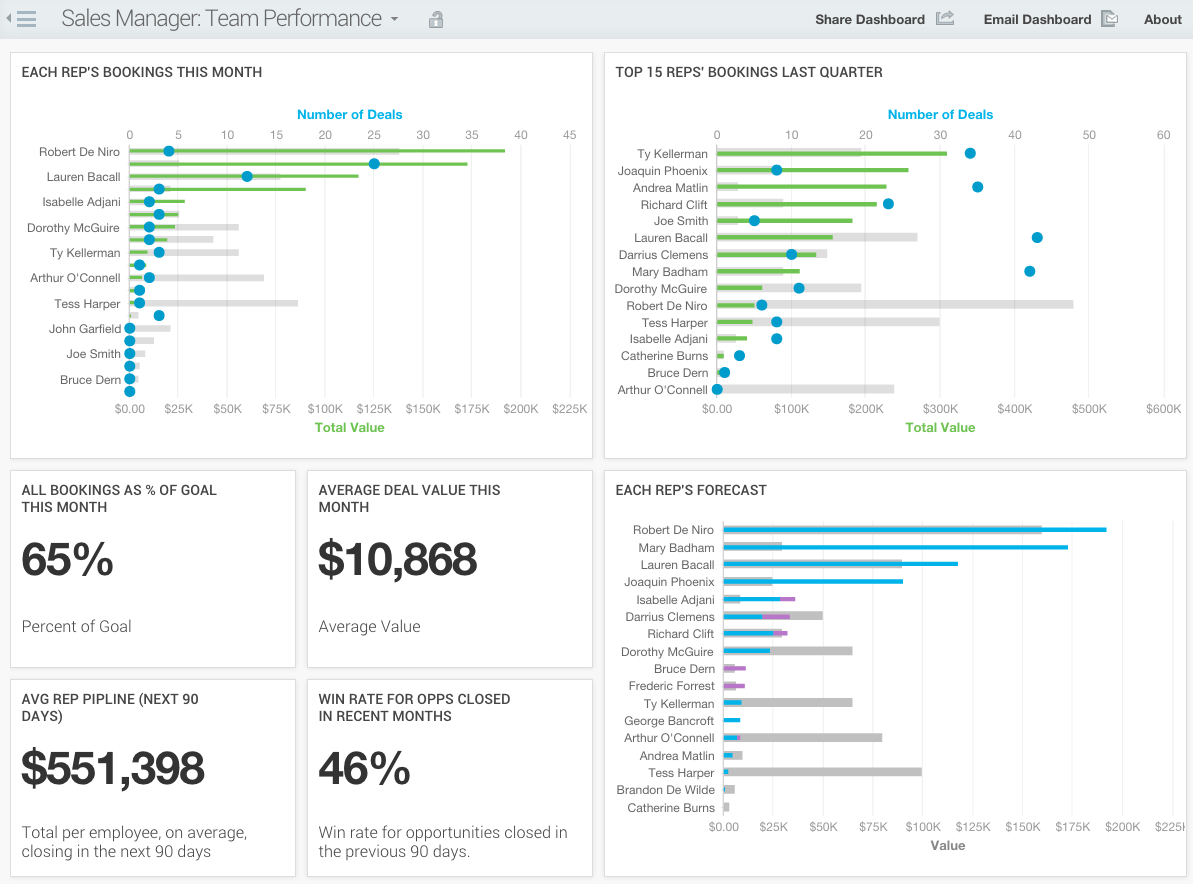
InsightSquared is a sales performance management and analytics platform built for fast-growing tech companies. They help teams plan sales activities, track performance, and manage a constantly changing pipeline. Managers can connect InsightSquared to a compatible CRM and use it to create better forecasts, analyze leads, opportunities, and deals, and keep salespeople accountable for both revenue goals and data quality.
The system offers a number of different dashboards businesses can use to identify patterns and maintain visibility into their process and productivity. The sales performance dashboard above is a great way for managers to keep tabs on which reps/SDRs are pulling the most weight, and which ones might need a little motivation. You can see bookings by rep, per month, historical bookings, and a forecast of what each rep is expected to close by the end of the month. The tickers on the lower left-hand side display progress to goal, average deal value, and your average win rate, based on deals closed in the past 90 days.
You can customize these widgets and set up alerts based on specific KPIs using the menu at the top. Need to share your findings? Use “share dashboard” or “email dashboard” to extend access, whether you’re presenting at an investor meeting or sending a forecast to your CEO.
SalesLoft – Prospect Conversations Dashboard
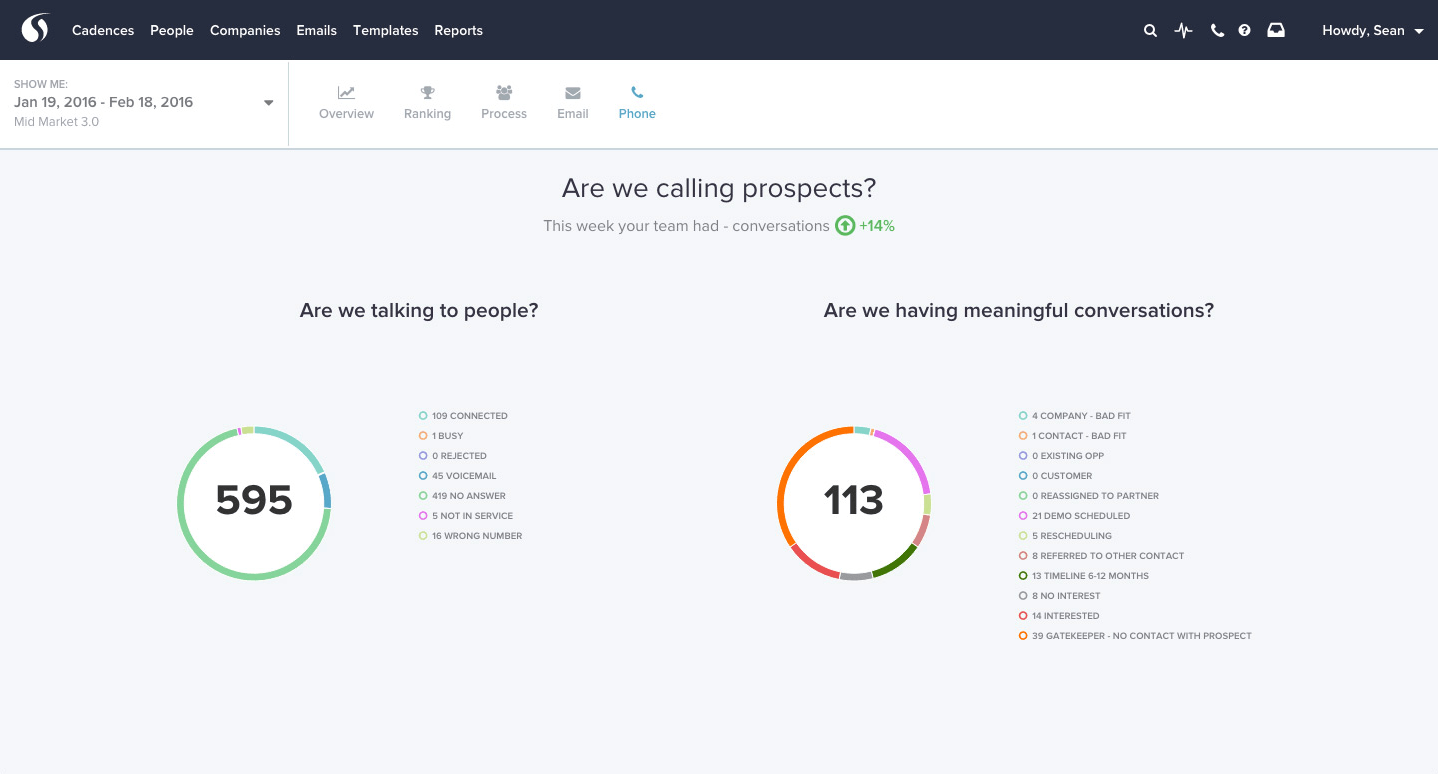
Salesloft is a sales development platform with a narrow focus: help SDRs schedule more demos and appointments. It provides features for email tracking, analytics, account management, and an auto dialer. As a true best-of-breed solution, Salesloft has focused on perfecting their core functionality. Even so, they offer a number of built-in reports and dashboards to provide insight about sales development activities and connect rates.
The dashboard above is listed under “phone” in the reports tab of the application. This one is unique because it focuses on specific activities within the development process, rather than broad revenue goals. The data displayed reflects how successful your team has been in connecting with prospects on the phone — how many have answered, were busy, rejected, not in service, or went to voicemail. The graphic on the right side breaks the data down further, providing insight into calls that actually connected.
You can filter data by date range and specific market segments at the top. In addition to the prospect conversations dashboard, SalesLoft’s reporting features also cover email engagement, team activity, individual rankings, and process compliance.
* * *
In reality, these four examples are only a small cross-sample of the hundreds of different reporting and analytics tools available for B2B (and even B2C) sales teams.
To browse other solutions, read reviews, and get a custom recommendation for your business, check out our data visualization and sales intelligence software categories.