
Data mining, or finding insights from your existing data, is common among data analysts and business intelligence pros, but because of today’s fast and easy data visualization tools, data mining is becoming more common for individual contributors and managers to use to gain insights that will help their teams run better, or avert potential disasters before they strike. This article gives you a brief overview of the five most common data mining techniques, but in language non-analysts can understand.
Also Read: 7 Sales Analytics Tools for Driving Revenue Growth
Start with a Plan for Your Data Mining Project
Of course, once you get your hands on all that structured and unstructured data, a whole warehouse or lake or some other storage metaphor-full, you still have to plan how you’re going to use it.
Outline your business objectives: Whether it’s better understanding your blog’s target audience or optimizing a product line or understanding how the weather affects your supply chain, digging through data just for “discovery” is nothing more than a waste of time. Use your new data powers carefully, and plan what you hope to discover.
Check that you have the right tools:
- Connections to outside software: Although you can manually export data from the transactional software that creates the data, much of this data is quickly written over, so it’s best to tap right into the API and download the data as soon as it’s made.
- Data Quality: These tools ensure that low quality or unusable data doesn’t take up space in the warehouse, lake, mart, or other storage device. They can cleanse data as it’s moved into the storage facility, or once it’s been loaded in there.
- Data Storage: Whether your team uses a data warehouse, data lake, or other form of data storage, you’ll need a secure location for all of your data to live.
- Data visualization tools: While trained data analyst-superheroes may be able to extrapolate deep insights from spreadsheets, most of us humans need to see data displayed in a chart or graph in order to fully understand the implications. Data visualization tools can put information from different sources side by side so your team can make the connections they need.
- Dashboards: dashboards are a type of data visualization that provide teams and businesses with real-time data about progress toward goals. Use these to communicate business goals, celebrate wins, and understand where course corrections are needed.
Use The Right Data Mining Technique
Association
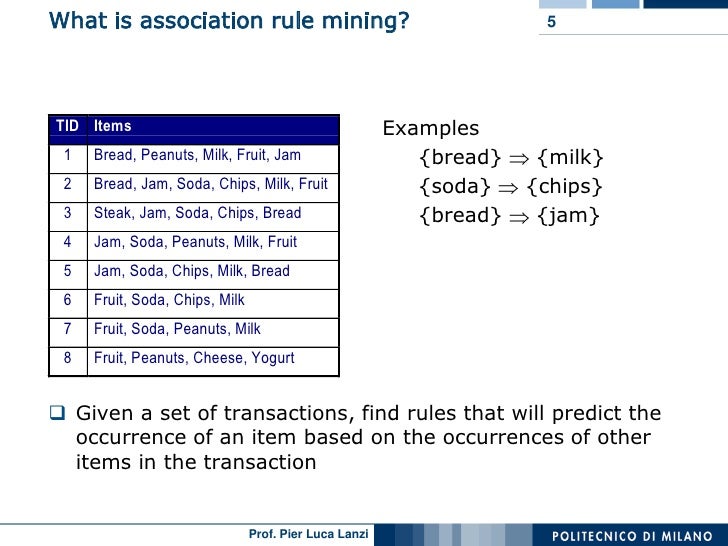
Association is simple correlation. It is used to predict which products are bought at the same time or along similar trend lines. This is a good way to get a simple understanding of trends, but it can also be dangerous. Just because two things happen at the same time doesn’t mean they’re related: correlation doesn’t equal causation
Use cases for Association techniques
Because association can easily be misconstrued, it’s best that teams only use association for data that is already closely related and doesn’t have a lot of outside forces working on it. Correlating the number of sales phone calls to the number of deals closed is a reasonable association; comparing trends of employee eye color with revenue growth is not.
Classification
Classification uses shared characteristics to understand groups. Customers can be classified by the size of spend, age groups, or other factors. Classification breaks large data sets down into smaller groups that can then be examined for trends. This technique is more precise than simple association. Because it lends itself to predictive results, classification of items from data mining can be visualized as a decision tree.
Classification in action
Use known classifications and features to understand other trends. The more data fields you have about a customer, product, or behavior, the more information you’ll be able to extrapolate. While many data storage tools allow you to manipulate unstructured data, you may want to outline several classification sets at the beginning of your product, so you know you have all the data you need before you begin your analysis. A good data visualization tool will be able to transform a data set into a decision tree or a similar classification tree.
Clustering

Clustering is plotting data based on multiple factors to understand trends. The resulting graph and plot points then provide a visualization of the data. In this visualization, clusters of data will imply similarities and trends. Can be used to prove or disprove a hypothesis, or to examine existing data to find unknowns.
When to Use Clustering
Clustering can be used when you try to associate data that does not correlate directly or when you try to examine data points that range widely. IBM provides a great example of clustering (seen in the above image) of the purchasing habits of people within different age ranges: the graph shows that those in their 20s and again in their 50s-60s tend to purchase more as they have more disposable income that might otherwise be tied up caring for children.
Anomaly Detection and Deletion
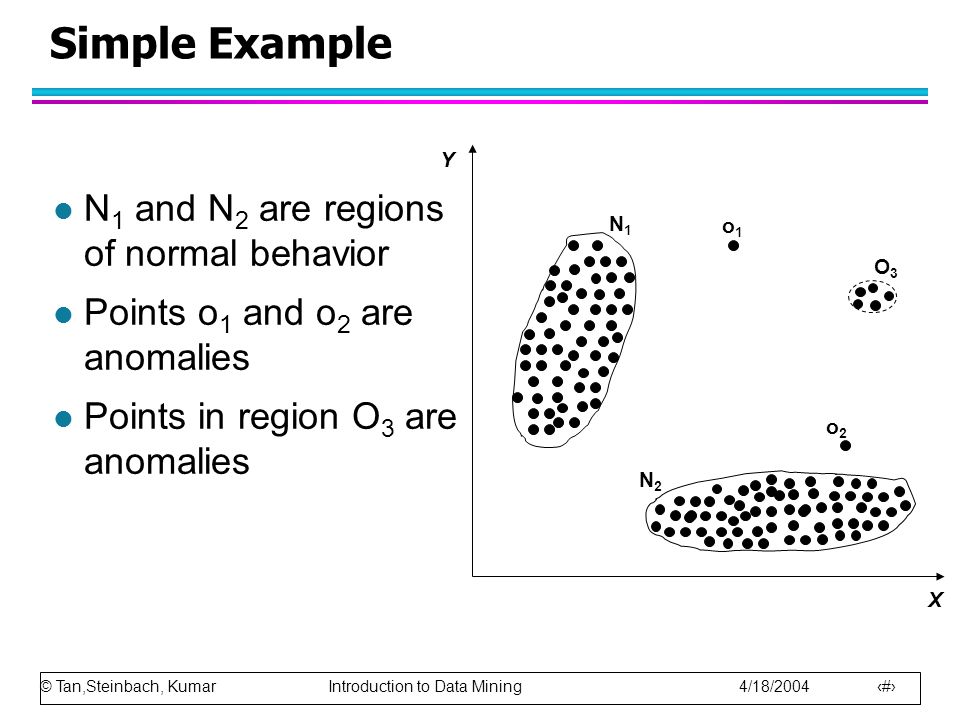
Anomalies, or outliers, can provide a lot of valuable information and may even help your team understand and spot fraud. These data points exist way outside the normal realm of existing data, so spotting them might not be too hard, but understanding their effects on the overall business data can be important.
Finding Anomalies
It’s particularly helpful to use data visualization tools to understand where the anomalies exist. Sharp peaks or valleys on a trend chart might indicate a legitimate purchase or increase in traffic, or they might indicate a fraudulent charge or a DDOS attack. To get a true picture of overall trends or averages, stay alert for anomalies that might skew the data.
Regression
Regression is a fancy name for making predictions based on the data you have currently available. An advantage of regression analysis is that you can examine multiple variables at once. Choose the piece of information you want to know more about (the dependent variable) and the types of data you think might affect that variable (the independent variables). Plot points with the dependent variable on the Y-axis and your independent variable on the X-axis. Then draw a line (or get your data visualization tool to do it for you) through the center of your plot points. Analysis of that line will show you how closely the independent variable affects the dependent variable.
Regression Analysis for Business Goals
This is where the really fun part starts. Do your teams swear up and down that sales depends on the day of the week? Does your marketing team try to come up with a market-related explanation for low lead generation? Regression analysis can try, with some degree of accuracy, to understand whether these gut feeling predictions are true, and whether they call for action.
Conclusion
Now what you’ve started visualizing all your data, and you’re drunk with the power of all the predictions and deep insights you’ve found from using these data mining techniques, remember a couple of things:
- Correlation isn’t causation Refine your analysis and searches, and don’t make huge business decisions based off your data until you ask whether the items are actually related, and whether you can prove it.
- Data visualization and analysis is a lot of fun–who doesn’t like to make discoveries? But just like any enterprise, make sure that your data makes an impact on your business goals.
Ready to start working in the data mines? TechnologyAdvice has the business intelligence tools you need to get started. Use our Business Intelligence Product Selection Tool to find your best fit software, or contact a Technology Advisor today at 855.718.1369 for a free, 5-minute recommendation.
Top Business Intelligence Software Recommendations
1 Domo

Build a modern business, driven by data. Connect to any data source to bring your data together into one unified view, then make analytics available to drive insight-based actions—all while maintaining security and control. Domo serves enterprise customers in all industries looking to manage their entire organization from a single platform.
