
Enterprise-level business intelligence software is a high-competition sphere, and the competition continues to heat up.
Recent back-to-back acquisitions for billions of dollars of first Looker ($2.6 billion) and then Tableau ($15.7 billion) highlight the growing trend: enterprises want data analytics solutions, preferably coupled closely with their existing data sources. These systems give the impression of data security and streamlined growth, whether or not that’s actually the case.
If there was any doubt before (there wasn’t), the purchases of Looker and Tableau solidify Google and Salesforce firmly within the enterprise software competition. It’s a space where wide-reaching multi-branded software giants like Microsoft and Oracle have been for years. Giant multitool software corporations — that manage exponentially growing amounts of data for businesses of all sizes all over the world — keep getting bigger.
Tableau and Looker are just two of the business intelligence software solutions available. If you’re looking for something smaller or more specialized, we can help you choose the right BI tool for your company, no matter your company size or data volumes. Click on the image below for a fast list of recommendations based on your needs. (Comparison continues below image.)
Loading and running data
While both Tableau and Looker say they provide users with easy access to their data sets, these tools are built for businesses with data analysts, data scientists, or business intelligence professionals on staff. You’ll need trained professionals with specialized knowledge to use these tools.
Tableau’s focus on data governance gives companies the freedom to upload data sets and host them on premises or in the cloud. Once loaded, the data sets can be queried fully throughout the program, giving users access to the full set and not locking them into predefined queries or visualizations. Users use statistical languages to query data, or they access new data views with natural language questioning.
Looker can be slow to access data, but teams can use the scheduling feature to pull data sets into the tool during off-peak hours. This may cause a little back and forth with your data if you’re unsure about what you’d like included in a visualization, but it won’t cause significant issues for most teams and queries. To access data, upload it into a SQL database and map it to LookML, Looker’s proprietary querying language that’s designed to improve the querying process.
Dashboards
BI dashboards are where most business users will spend their time within a BI tool. The point of a BI software is to display data in an easy to understand format that matches the complexity of the question and the needs of the user. The best tools make dashboards accessible for business users to manipulate data without the assistance of a data analyst. You’ll find advanced graphics and vast visualization capabilities in both Tableau and Looker, and both tools make it easy for business users to manipulate data sets within dashboards and visualizations.
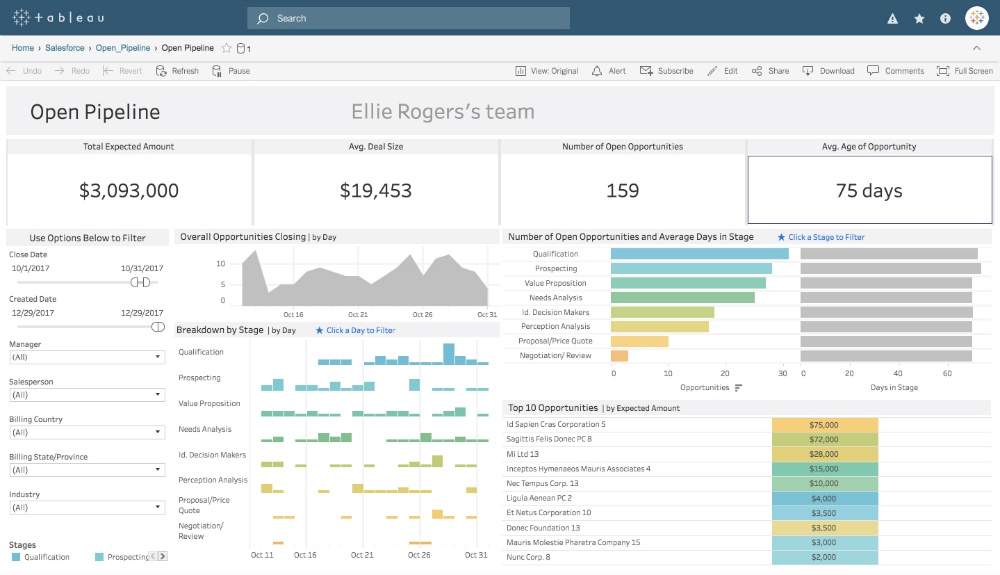
Tableau’s drag and drop visual editor lets users ask questions of the data sets available to them — in real time. Tableau’s real-time data access gives it a distinct edge over Looker, as users can transform data quickly with different queries pulled directly from the database, rather than limiting queries to pre-approved data.

Looker lets data analysts set up data for dashboards within several different team spaces. User access can be granular based on space, dashboard, or all data. Depending on the user’s access and skill levels, every part of the database is accessible through Looker. This makes data available for the entire company to explore and use to improve business processes.
Data connectors and integrations
Tableau has a thriving community of developers who contribute data connections to the open source connector community. You can choose to connect your data to Tableau through an API, a custom connector, or by more traditional methods of connecting a database or uploading a .CSV file. There are a few native connections to big name software like Salesforce, Hortonworks, or AWS, but most connections will need to be made in-house with custom coding.
Looker’s tools run on their proprietary SQL language, LookML, so companies hoping to use the software will need to make their data accessible within one of over 35 SQL databases. Once connected, data analysts will need to map the data to the LookML language for user access.
Embedded analytics
Both Tableau and Looker offer embedded analytics tools to make business intelligence available to customers. Use these tools to add customer dashboards within business apps. These visualizations can be manipulated by end users without needing to access the BI tool directly, providing the company with opportunities to white label analytics.
Tableau offers embedded analytics with a fully customizable interface through a JavaScript API. Once embedded, Tableau users can define what data customers access by hiding or exposing available data. The exposed data has the same flexibility and customizable views that companies can access within Tableau.
Looker’s embedded analytics are also available with developer tools like APIs, SDKs, and an integration library to help developers focus on building apps instead of building custom BI tools. Embedded Looker visualizations are flexible and customizable for the end user, with similar behavior to that found in the Looker tool. End users can even schedule alerts within the visualizations, adding value to the provider.
Tableau vs Looker — or another BI software?
These two tools are not for the data dabbler. They are serious data analysis and business intelligence tools made for companies who have dedicated data resources. While there may be use cases for small businesses to purchase Tableau or Looker, make sure someone on staff (or on contract) has the necessary SQL or data analysis experience to manage the tools.
Tableau and Looker aren’t the only BI tools available, and they won’t be right for every team. Our Technology Advisors connect businesses with the right business intelligence software every day. Click the image below, or contact us today to get a list of the best BI software for your business needs.
Top Business Intelligence Software Recommendations
1 Domo

Build a modern business, driven by data. Connect to any data source to bring your data together into one unified view, then make analytics available to drive insight-based actions—all while maintaining security and control. Domo serves enterprise customers in all industries looking to manage their entire organization from a single platform.
Get our best stuff.
