- Comparing Alteryx vs. Tableau may seem like a good idea, but these business intelligence products don’t serve the same functions.
- Instead of trying to choose one over the other, use them both! Here’s how to do that.
When shopping for a business intelligence solution, some people try to compare Alteryx vs. Tableau. This is understandable — both products fall under the umbrella of business intelligence software. But Tableau primarily functions as a data visualization system with few tools for data cleansing while Alteryx works great for data cleansing but lacks good data viz capabilities.
Instead of trying to decide whether you should go with one of these business intelligence solutions over the other, use them both. They complement one another, which helps you get the best insights from your data.
If you’re still looking around for the best business intelligence systems for your needs, we can send you a free list of recommendations. Use our BI Product Selection Tool to request your shortlist of the top five BI solutions for your organization. Getting started is easy and takes less than five minutes.
Topics
Alteryx: what it does best
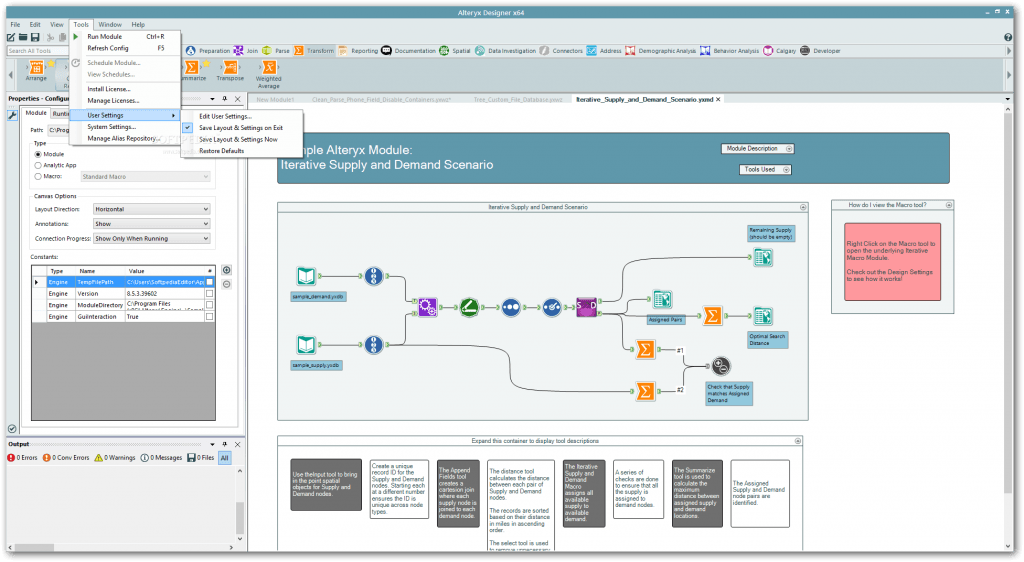
Alteryx is an ETL system, which means it’s designed to extract, transform, and load massive amounts of data from a variety of different data sources. This system is designed for use by BI analysts, but it works just as well regardless of whether or not you use SQL.
Alteryx uses workflows to engage with data throughout the ETL process, and the system allows you to make these repeatable so you don’t waste time on manual processes. A scalable and intuitive user interface (UI) makes working in the software fast and easy to learn, and flexible and diverse data discovery and management tools let you access dozens of data connectors and make edits to the incoming data.
One major shortcoming with Alteryx is data visualization. You can use Alteryx to generate reports, but these aren’t accessible to employees who don’t work in data or business intelligence. Instead, Alteryx offers Analytic Templates for loading data into third-party visualization platforms.
Also read: Qlik vs. Tableau: Comparison Of Key Differences
If you use Qlik or Tableau for data visualization, Alteryx also supports direct data integration. Using this feature, you can load your data directly into Qlik, Tableau, or Microsoft Power BI once you’ve cleansed and prepared it in Alteryx.
Tableau: what it does best
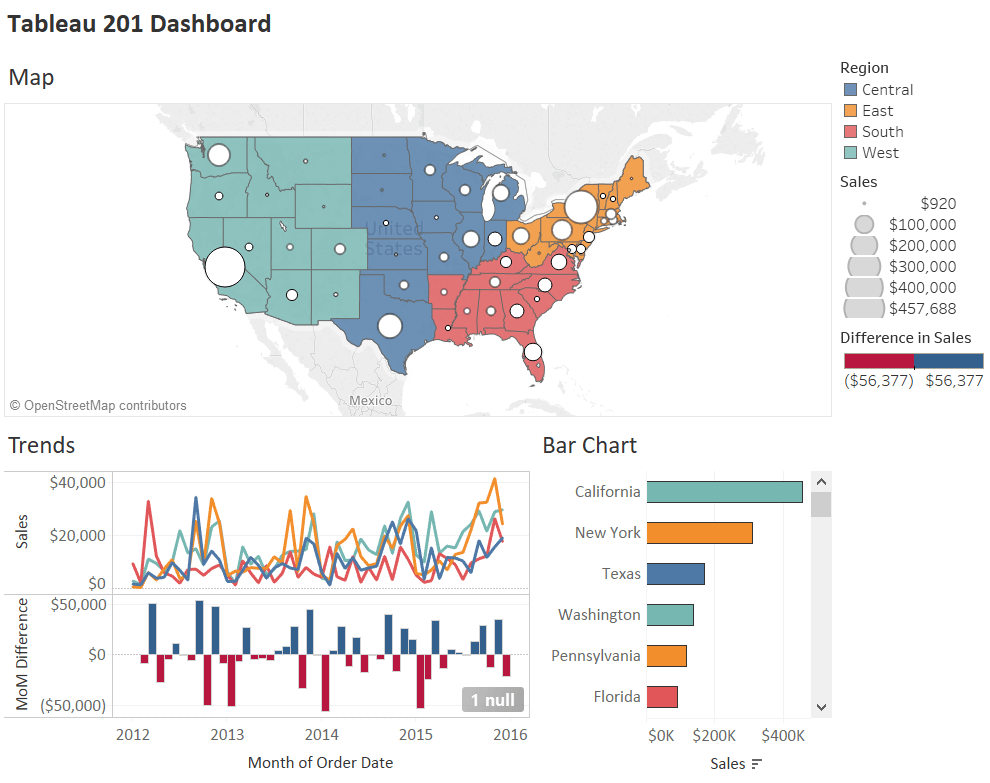
Tableau is a data visualization platform that uses drag-and-drop functionality to create a variety of interactive graphs and charts. People know Tableau for offering some of the best data visualization tools on the market, and they use this system to reveal hidden insights and to tell stories with data.
Using Tableau, you can create forecasts, spot trends and outliers, generate maps, and more. Similar to Alteryx, Tableau uses drag-and-drop functionality, but in Tableau, you apply visuals to data segments to see data in different ways instead of imposing various transformations on data to clean it. This means people with any amount of coding know-how can use Tableau, but the system also supports natural language in addition to custom SQL queries.
Also read: The TechnologyAdvice 2019 Best Business Intelligence Software Awards
Tableau’s biggest blind spot is data cleansing and preparation. It does an excellent job of visualizing the data you load into the system, but it doesn’t come with tools for data blending and cleansing. For this, Tableau offers an Alteryx Starter Kit for Tableau, which makes it easier for you to prepare your data in Alteryx and then load it directly into Tableau for visualization.
Using Alteryx and Tableau together
For data scientists and business intelligence analysts alike, the combination of Alteryx and Tableau is a lifesaver. If you spend a lot of time writing code to prepare, cleanse, and analyze data, Alteryx will save you hours of writing SQL and R code. If you have no idea how to code, Alteryx empowers you to work in data using drag-and-drop features. Once you load your clean data into Tableau, you can uncover hidden insights and make your organization’s data more accessible to everyone using high quality visualizations.
Generating Tableau Data Extracts
Perhaps the biggest value-add Alteryx offers is the ability to convert datasets to Tableau Data Extract (.tde) files. Making a Tableau Data Extract compresses data to reduce storage requirements and to optimize it for visualization in Tableau.
These extracts are columnar stores, which means they aggregate data into columns instead of rows. This improves performance in Tableau and speeds up load times, not to mention that it also eases file sharing and collaboration.
Cleansing data for more insightful visualizations
Using Alteryx with Tableau together goes beyond simply making data visualization easier. Clean data is valuable data. By corollary, data with missing values, structural errors, and other impurities is not. Even worse — impure data costs you money, both via opportunity cost and bad decisions.
This reminds me of a famous quote from Bill Gates: “The first rule of any technology used in a business is that automation applied to an efficient operation will magnify the efficiency. The second is that automation applied to an inefficient operation will magnify the inefficiency.”
By tweaking some of the wording, we can also apply this lesson to business intelligence software:
“The first rule of any business intelligence software is that visualization applied to clean data reveals good insights. The second is that visualization applied to messy data reveals poor insights.”
Tableau does a great job at visualizing data, but if your data still needs some TLC, you’re wasting your time. Cleansing your data in Alteryx before loading it into Tableau will save you time and make you more money.
Not convinced Alteryx and Tableau are right for you? We can help.
At TechnologyAdvice, we work with BI analysts every day. We know your pain points, and we want to help connect you with the right software. To get a free, personalized list of recommended business intelligence products, use our Product Selection Tool for Business Intelligence.
We’ll send you a shortlist of the five best tools for your specific needs so you don’t have to waste any more time searching for the right solution. Getting started is easy and takes less than five minutes.
Top Business Intelligence Software Recommendations
1 Domo

Build a modern business, driven by data. Connect to any data source to bring your data together into one unified view, then make analytics available to drive insight-based actions—all while maintaining security and control. Domo serves enterprise customers in all industries looking to manage their entire organization from a single platform.
Get our best stuff.
