Businesses are rapidly increasing their consumption of data, and Statista expects the amount of data we make and store to increase to over 180 zettabytes globally by 2025. Data is important, but without the right analytics tools, businesses can’t actually use any of it. Business analytics tools help organizations make sense of the data they collect and turn it into actionable insights that they can use to improve their offerings. We’ve put together this guide to help you find the perfect business analytics tools for your organization.
To skip the guide, use our Product Selection Tool by clicking on the banner at the top of the page. After answering a few questions, you’ll get a customized list of business analytics software recommendations for your company.
Jump to:
- What are business analytics tools?
- Compare the best business analytics tools of 2022
- Key features of business analytics tools
- Benefits of data analytics software
- Industry considerations for business analytics tools
- Choosing the best business analytics software for your company
What are business analytics tools?
Business analytics software retrieves data from business applications to help organizations gain insights about sales, customers, and costs. It is typically available both on-premises and in the cloud, and it includes artificial intelligence (AI) to provide suggestions, automate data analysis, and make predictions. Some companies opt to use best-of-breed analytics tools for data visualizations, data mining, and predictive analytics, but others prefer a software suite that includes everything in one.
Compare the best business analytics tools of 2022
|
Qlik |
yes | yes | yes | yes |

Tableau |
yes | yes | no | yes |
Dundas BI |
no | no | yes | no |
SAS |
yes | no | yes | yes |
Splunk |
yes | yes | yes | yes |
| Product | Artificial Intelligence | Natural Language Search | Automation Reports | Simulation |
|---|
Qlik
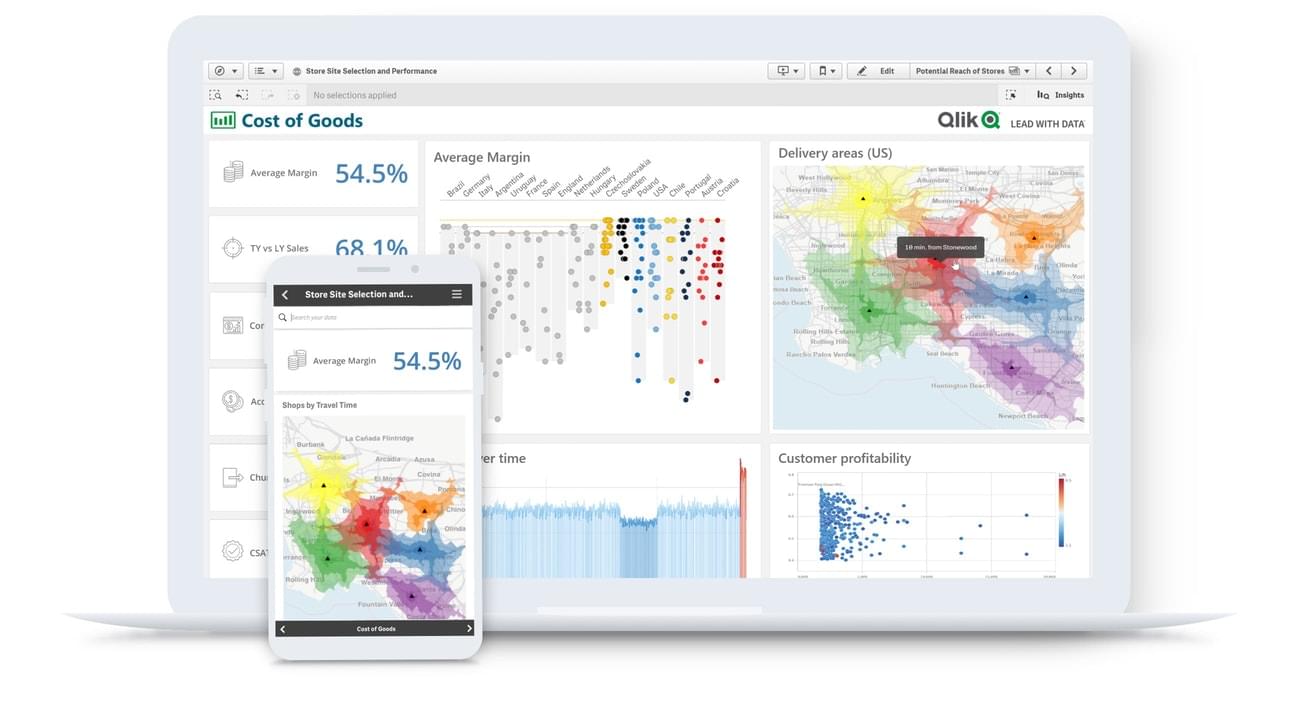
Qlik is a cloud business analytics platform that offers interactive dashboards and conversational searches, enabling self-service analytics for all users, not just data scientists. The machine learning tools provide predictive analytics to highlight trends and provide insight into the data. The reports are customizable and users can schedule them to automatically send at predetermined intervals, so they always have the latest information. Additionally, the mobile app lets users create visualizations from their phone or tablet, which is helpful for sales teams that might need to manipulate data while on the road.
Also read: Qlik vs Tableau: BI Software Comparison
Tableau
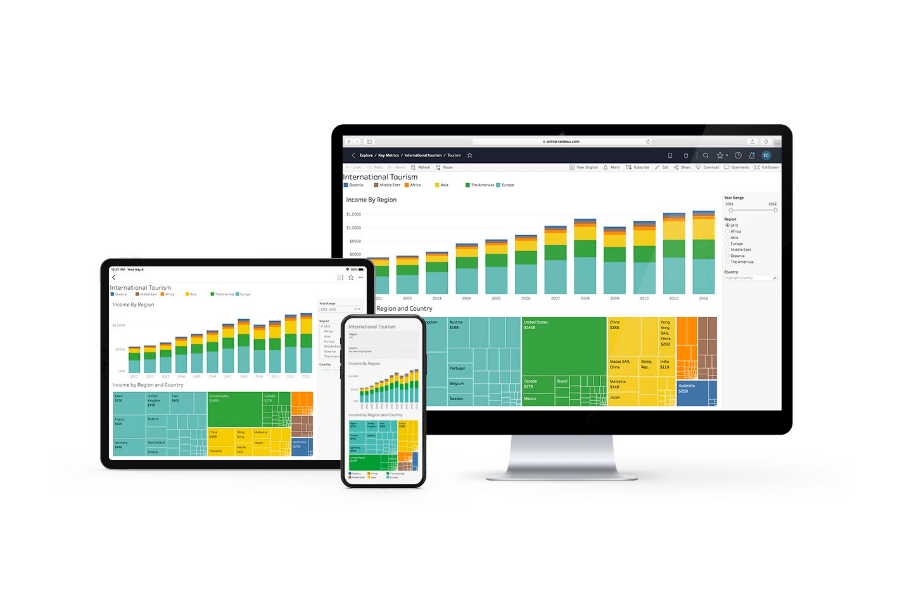
Tableau, now owned by Salesforce, is a visual data analytics tool available in the cloud or on-premises. It offers flexible deployment and end-to-end analytics for better business decisions. Native integrations with Slack and Salesforce make it easier to pull data from across the business and analyze it using Salesforce’s Einstein AI. Statistical modeling helps organizations determine if-then possibilities. For example, a retail company might examine a possible change in their revenue by removing one of their less profitable product lines to understand whether the cost savings on materials would offset the lost profits. For companies hoping to expand data literacy to more business users, Tableau also provides a free eLearning course to provide employees with data skills that they can use to improve their roles.
Also read: Power BI vs Tableau: A Data Analytics Duel
Dundas BI
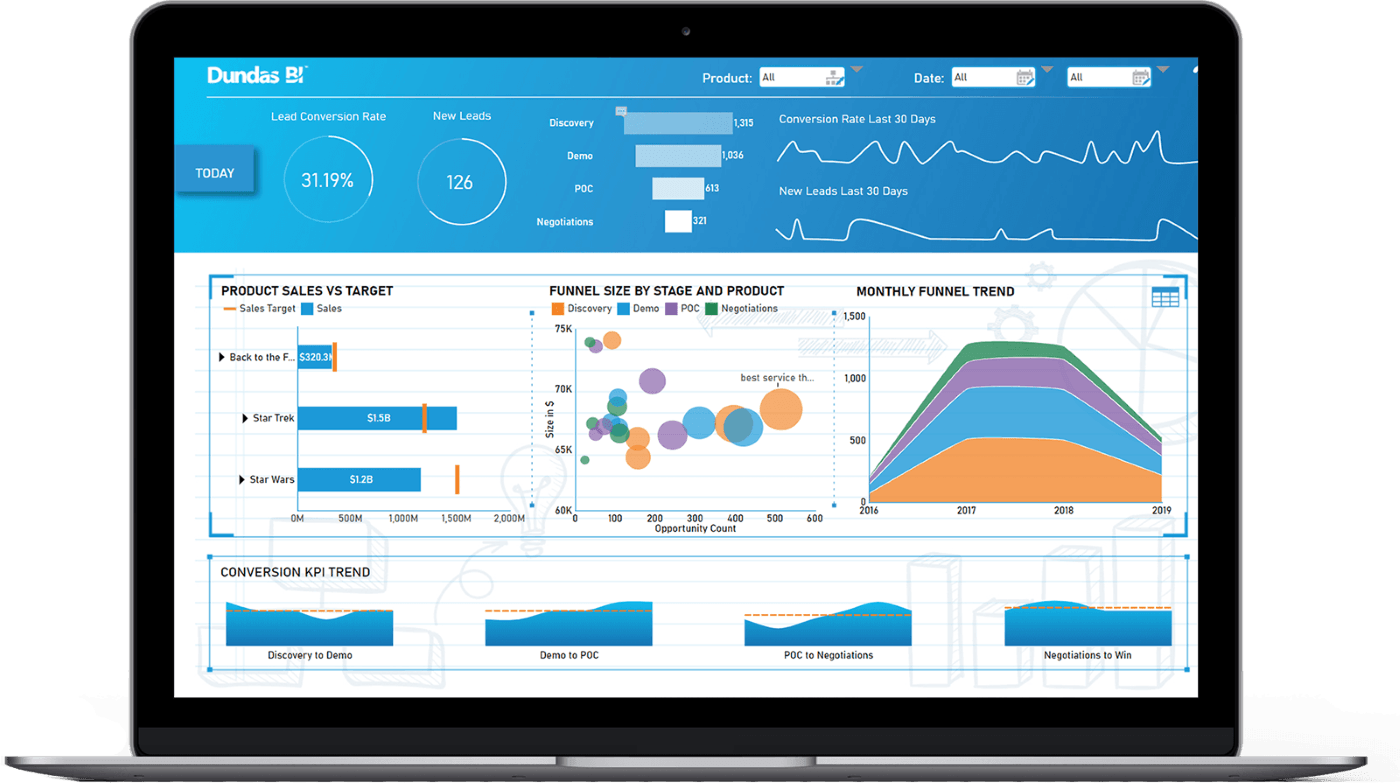
Dundas BI is a business analytics solution built for medium to large enterprises. It’s completely customizable and offers open APIs, so organizations can pull and analyze data from all of their applications. Each user gets a personalized experience based on their role that keeps business users from getting bogged down by all of the options that data analysts need. Data analysts can design their own reports and dashboards while other employees can access and search through those reports to find the information they need. And by adding comments and questions to the reports, users can collaborate with each other to find the most pressing insights.
SAS
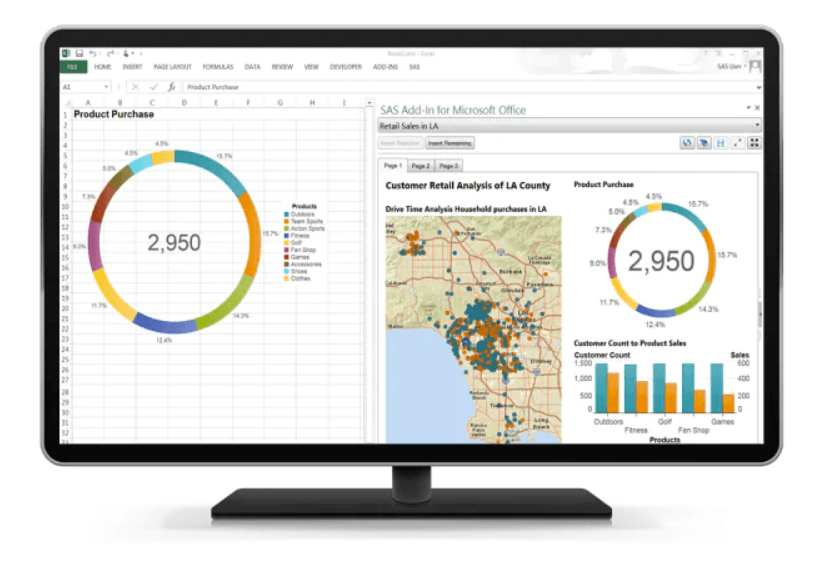
SAS offers visual analytics software that combines reporting, analytics, and data exploration into one platform. The low-code interface allows users to create chatbots that use natural language processing, so they can use conversational queries to find relevant information. AI and machine learning can highlight relationships between data to help users gain important insights faster. And predictive analytics allow users to identify possible outcomes of the courses they’re considering, so they can make decisions that the data backs up. Users can also add geographical context to their reports, showing which customers are the most engaged or which store locations perform the best.
Splunk
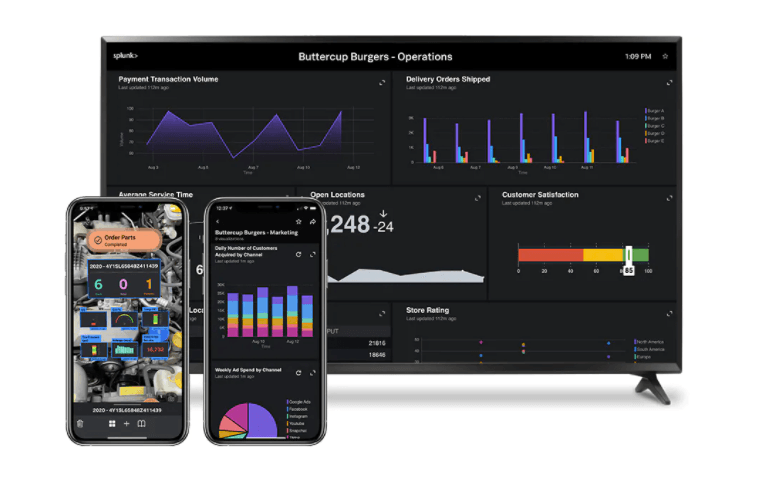
Splunk is a data analytics platform built to improve the efficiency of IT departments. It even includes step-by-step guidance to help users get the most out of their data. Machine learning and AI offer forecasting and predictive analytics to identify areas of inefficiency and heightened operating costs. Additionally, through collaboration, users can build models using common data science languages like Python and SQL. Splunk works with both structured and unstructured data, and users can ask questions in conversational language to find information. The tool is also scalable and integrates with a variety of other applications.
Key features of business analytics tools
These are the main features you should look for in your data analytics tools, whether you’re looking at best-of-breed or a full suite.
Artificial intelligence
In the top business analytics tools, AI helps organizations identify patterns and oddities in the data and make predictions for the future. Retail and manufacturing businesses can use these predictions to determine how many people they’ll need on staff each day, while product-based businesses can use them to determine their inventory needs.
AI can also take unstructured (qualitative) data from user reviews, social media posts, and survey feedback and use text analysis to turn it into structured (quantitative) data that businesses can then gather insights from.
Also read: What is structured vs. unstructured data?
Real-time data updates
In order to get the best insights, businesses need to use the most recent data they have. Because of this, business analytics tools need to update in real-time as new data comes in. Real-time data can help businesses identify website issues before they lose too much traffic and react to market trends faster. Up-to-date data is especially important for small business analytics because they typically have the flexibility to adjust to changing market conditions.
Shareable visualizations
People don’t consume data in a silo; they work with their team members to determine how their insights impact the business and what they need to adjust. When employees create data visualizations, they need to be able to easily share them with their coworkers, so they can collaborate on analysis. Additionally, data scientists can push embedded analytics to the applications where users are making important decisions, streamlining the decision-making process and reducing the risk of error.
Most business analytics tools offer shareable reports that users can export as a PDF and then email to key stakeholders, but those reports are static. Top analytics software, however, will allow users to collaborate on dynamic dashboards and visualizations that allow them to manipulate different parts of the data.
Also read: Driving Business Results with Embedded Analytics
Benefits of data analytics software
Business analytics tools and techniques help organizations make better business decisions to improve efficiency and reduce waste. Here are some of the benefits companies can expect.
Higher customer satisfaction
When companies are able to turn unstructured data from customer feedback into structured data that they can gain insights from, they have a better understanding of what their customers want from products and services. Software companies, for example, often include questions on their surveys about features that customers want to see. By analyzing the responses, these businesses can add the most popular features first and increase their customers’ satisfaction.
Reduced operating costs
With predictive analytics, businesses can reduce their operating costs by getting more accurate sales predictions. When companies have close estimates for sales numbers, they can staff the right number of people and order full quantities rather than smaller runs, which are generally more expensive. Additionally, better data insights can help businesses improve their processes and become more efficient which can reduce the need for additional personnel.
Increased revenue
Using business analytics, organizations can identify their most popular and profitable offerings as well as their least popular. If they aren’t making money from some of their product or service lines, they can cut those out and focus their efforts on the more profitable options. They can also use their customer feedback to improve their offerings according to customer needs, retaining their current customer base and encouraging referrals for new customers.
Industry considerations for business analytics tools
Businesses in different industries will use their business analytics software in different ways. Here are some examples of the things organizations in different industries should look for.
Manufacturing
The manufacturing industry relies heavily on both shift work and inventory management. These businesses require business analytics software that includes predictive analytics, so they know how many people to schedule for each shift, how much inventory they should have on hand, and how much product they need to produce to meet consumer demand. Additionally, they’ll need data analytics tools that integrate with their Internet of Things (IoT) devices, so they can collect data directly from those machines.
Financial services
Financial institutions are heavily regulated and their business analysis tools should include strict compliance features, like encryption and identity control to keep their data safe. They may also place a higher value on reporting features for compliance and audits. Financial institutions should also look for a cloud-based system that updates in real-time, so they always have access to the latest data.
Public sector
Because the public sector often communicates with other agencies and their communities as a whole, they need business analytics tools that can easily share dynamic visualizations with people outside of the organization while also making static reports publicly available. They’ll also need to be able to manipulate the data they have to analyze how different responses would affect data. For example, the CDC might look at the current rate of COVID-19 infections and manipulate the data to see how it would change based on different responses, like vaccines and masks.
Choosing the best business analytics software for your company
To find the best data analytics software for your business, you need to determine whether you’re looking for best-of-breed tools or a full business analytics software suite. Then, you’ll need to decide which features are most important. Maybe you don’t need a mobile app, but you’ll need to be able to customize your reports.
For help choosing a business analysis tool, use our Product Selection Tool by clicking on the banner at the top of this page. After answering a few questions, you’ll get a short list of customized software recommendations.