
It all started in 1896, when a Polish engineer named Karol Adamiecki invented a diagram called a harmonograph to improve the way production schedules were displayed. A few years later, he published articles in Polish and Russian describing the diagram . . . which is probably the reason we don’t have an “Adamiecki Chart,” but instead a “Gantt Chart.”
While Adamiecki was busy publishing in languages foreign to the English speaking world, Henry Gantt, an American mechanical engineer, was working on a similar method of displaying processes and interdependencies. Between 1910-1915, he was able to popularize his method in English. Hence, the solution was attributed to Gantt, and he became “the father of Gantt Charts.”
In the beginning, all Gantt Charts were created by hand, on paper, and when the project needed to be changed, they had to be redrawn, which obviously wasn’t convenient. Later, this problem disappeared with the invention of personal computers and software development. For almost every project management team, desktop software and web-based applications have completely replaced the old Gantt Charts.
Why Are Gantt Charts Useful?
Fast-forward 100 years, and the Gantt Chart is now the best way to display tasks and activities against time and still one of the most useful and popular planning techniques in project management.
Why? Because a Gantt chart is the perfect ally for planning and scheduling projects: it tells you exactly who is assigned to do what, when to start, and how much time it will take to complete the job.
On the left side is a list of all tasks, and on the right side, each task is displayed on a timeline by a bar that represents the duration of that activity.
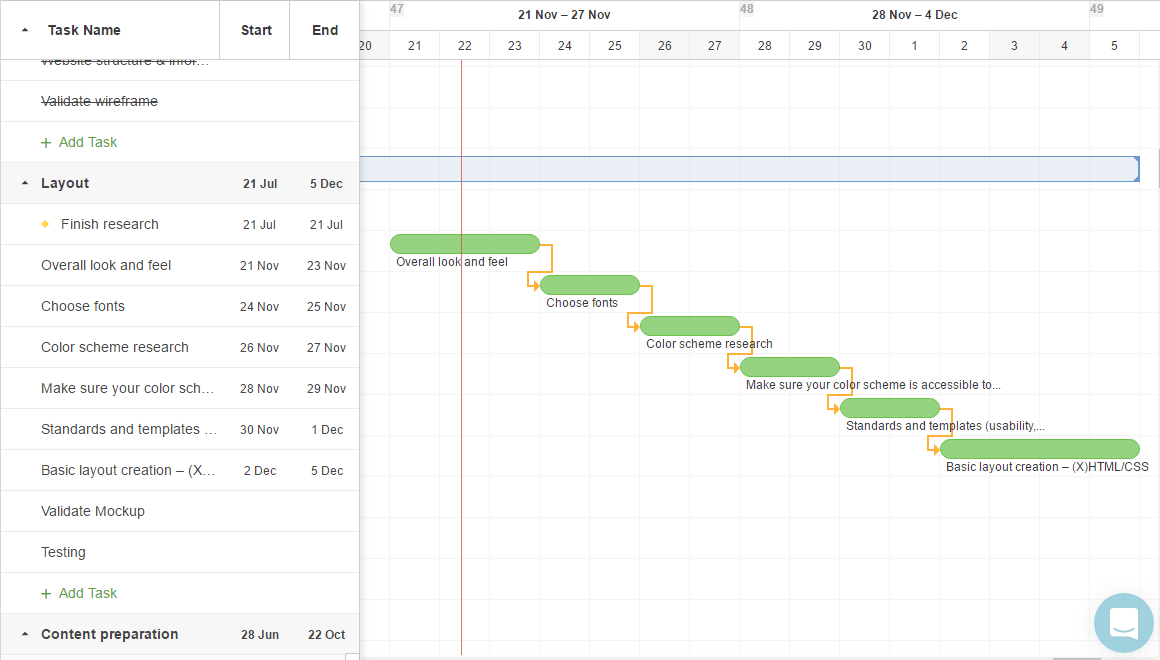
Example of a Gantt chart built in Paymo.
A Gantt chart also shows you which activities overlap and the connections between interrelated tasks. For most, building these diagrams is intuitive and self-explanatory, with no special training required. Once the diagram is built, everyone involved in the project can easily understand what’s going on.
Project monitoring requires constant attention, team communication, and schedule adjustments to make sure you stay on budget and ahead of schedule. While most of this relies on the project manager’s soft skills, a Gantt chart will make the work much easier.
Each task bar can indicate completion percentage, which will help PMs decide if extra resources need to be allocated. Most software platforms will let you make changes by dragging and dropping tasks, dependencies, or milestones, and automatically updating other project components that are affected.
How to Create a Gantt Chart
In order to create a Gantt Chart, you can use a dedicated project management software with a Gantt feature or “good old” Microsoft Excel. Both have advantages and disadvantages, as you’ll see in a moment. Whichever you choose, the steps of creating the chart are pretty much the same:
- Make a list of all the tasks in your project
- Estimate the duration of each task and assign them to team members
- Decide which tasks are independent and which depend on other ones
The next step is to identify the “critical path.” While some believe the critical path contains the most important tasks, it’s really just the longest sequence of dependent tasks in a project — these represent the minimum amount of time required for the project to be completed.
The easiest way to draw the critical path is to create a network diagram first. You can do this by drawing each project task and its duration on paper and linking the tasks between them, or by using some kind of mind-mapping tool.
Once you’ve identified the critical path, you can start adding tasks, one by one, in chronological order. After you finish, add the independent or “floating” tasks that can be completed regardless of the status of other tasks. The floating tasks should be grouped at the bottom, and the critical path should remain on top. This will make it easier to monitor and adjust the project.
Excel or Dedicated Gantt Software?
When it’s time to choose a tool for creating your charts, you have three options: project management software with a Gantt chart module, standalone Gantt chart software, or Excel.
Excel is fairly versatile and capable of building Gantt charts. The main advantage of creating the chart in Excel is the ability to customize it. Disadvantages: the bloated interface, the extra manual steps involved, and the special skills required to turn spreadsheet data into a dynamic visual tool.
Dedicated Gantt chart software is an affordable option that will let you create charts for all types of projects. The downside, however, is that you won’t have access to other project management tools like time tracking, resource management, or collaboration. You’ll need to acquire, learn, and manage other apps to take care of those aspects.
Project management software with a built-in Gantt feature is an attractive choice because it provides all the tools you need to manage your projects from start to finish. Most modern platforms are inexpensive (compared to the ROI) and offer a user-friendly, cloud interface.
No matter what option you prefer, a Gantt Chart is an indispensable tool for managing medium to large projects, and in some cases (like construction projects) even smaller ones. To learn about other project management tools and features, check out the TechnologyAdvice Guide to Project Management Software.
Laurentiu Bancu is the marketing manager at Paymo. He covers project management, web analytics, and advertising. Connect with him on LinkedIn.
