

When was the first time you used the scientific method?
One of my earliest memories of using the scientific method was in elementary school. My 5th-grade teacher assigned my class a project to display at the science fair at the end of the year; the type of science fair where you had to get the huge tri-fold cardboard. She gave us the liberty to choose whatever topic we wanted to do our project on, as long as we used the scientific method we learned in class.
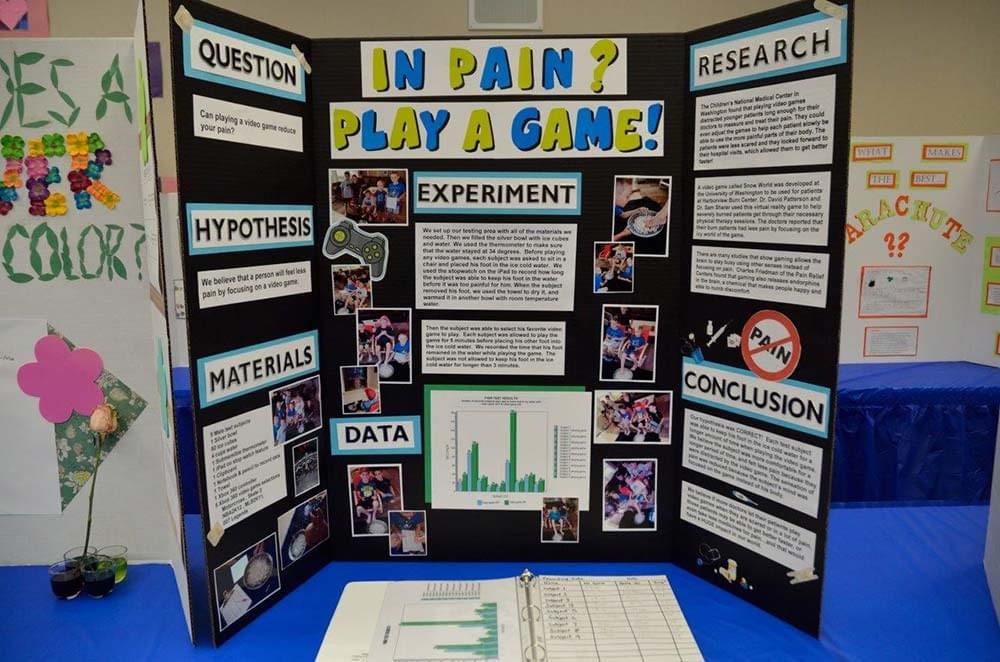
One night, I saw my dad cleaning the table with a paper towel and noticed that the towel continuously ripped as he cleaned. This inspired me to figure out which brand of paper towel was better for cleaning wet spots for my science project.
- I asked a question — “which brand of paper towel would be the strongest when cleaning wet spots?”
- I looked into industry data — about paper towels and who claimed to be the best.
- I set a hypothesis based on those insights — I think Brawny is better than Bounty because of xyz.
- I tested my hypothesis– I used a paper towel from each brand to soak up 235 ml of water and determined which one held longer.
- I analyzed & communicated the result.
The growth process, in a nutshell, is the scientific method. You ask a question, analyze an existing occurrence, set a hypothesis, then test an experiment to justify your hypothesis, analyze the results, and communicate the findings.
In this article, I’ll go through a step-by-step overview of how the growth process works. This process is an accumulation of things I learned from reading 100’s of articles from people such as John Egan, Andrew Chen, Brian Balfour, Sean Ellis, Morgan Brown, Susan Su, and many more people; also my own personal insights as well.
The Growth Process
I’ll be going through the basics of the growth process and using an example with fake numbers to demonstrate each step in context.
1. Ask a Question
The first step in the growth process is to ask a question and justify it. Many questions can be formulated by identifying both the key output (metric you’re trying to grow) and seeing what inputs make that output grow.
For instance, Airbnb’s key output is nights booked, so they want to see what features or behaviors (inputs) increase the number of nights booked. Amazon would be items purchased. Facebook would be daily active users.
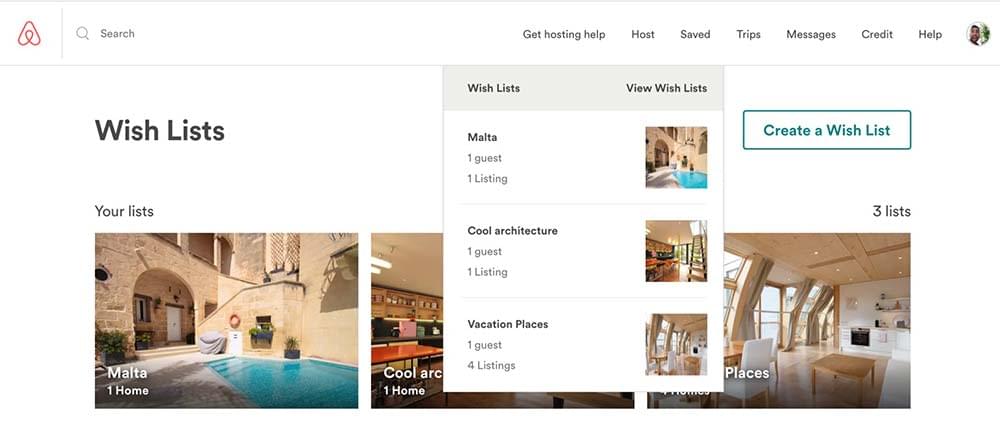
Example: Let’s say the Airbnb growth team assumes that people who add to wishlists tend to be retained long term and book more trips with Airbnb because they have interesting places they’ve saved to look back into.
The next step is justifying the assumption by diving into your growth models or analytics. In our example, one thing the Airbnb growth team could do is a run a correlation analysis to see if adding to a wishlist does actually increase the number of nights booked within a year.
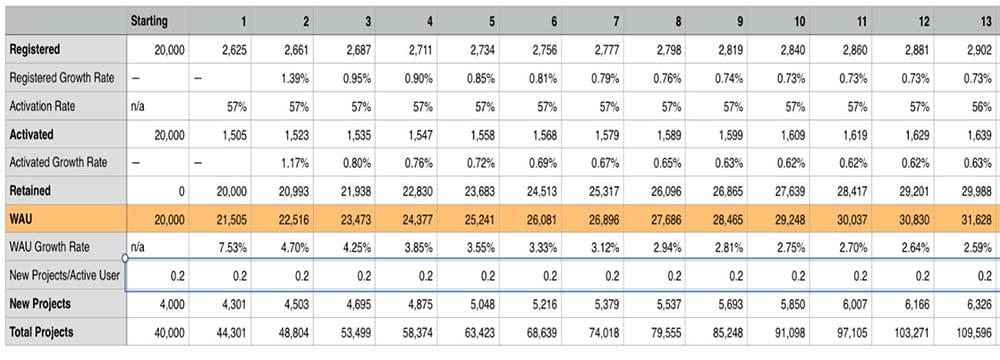
Growth model: a growth model is an estimated projection of inputs to outputs that is established by existing baselines. This is extremely helpful in identifying levers and figuring out where to focus your growth team’s energy. This is something I learned going through the Reforge program.
Here is an example growth model
Correlation Analysis– correlation is the relationship between sets of variables used to describe or predict information. What we’re looking for is the correlation coefficient which will determine the degree a set of variables is related (represented by “r”).
r = n(∑xy) — (∑x)(∑y) / ( √n(∑x²)-(∑x)²)(√n(∑y ²) — (∑y)²)
- -1 to 0 = negative correlation
- 0 to 1 = positive correlation
- closer to 0 = no correlation
Fortunately, there are tools to automate the correlation analysis for us, so we don’t have to plug it into a calculator each time.
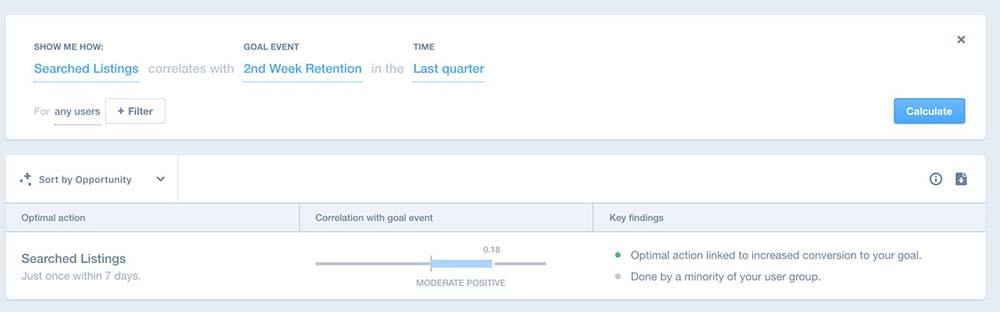
Example: Back to the Airbnb example; after diving into the data, the Airbnb growth team determined there was actually a strong correlation with nights booked and adding to a wishlist with a strong r of .79.
Framing the question: Adding to a wishlist is strongly correlated with nights booked. How can we increase the number homes added to a wishlist per person?
2. Brainstorm an Idea
The second step in the process is to brainstorm an idea that you’ll base your hypothesis on.
This is our output, and the ideas we brainstorm to answer this question will be our inputs. We make this our new output because we already determined that adding to a wishlist does affect the rate of nights booked with a positive correlation.
(inputs) idea 1 | idea 2 | idea 3 = Increase # of saved homes in a wishlist per person (outputs)
A good way to come up with ideas is to see what other products outside your immediate space do already, go off natural psychological behavior, associate two ideas together, or even ask why people are doing the behavior in your product itself.
Let’s dive back into the Airbnb example:
The question we asked: How can we increase the number of saved homes in a wishlist per person?
The Airbnb growth team comes up with 4 different ideas:
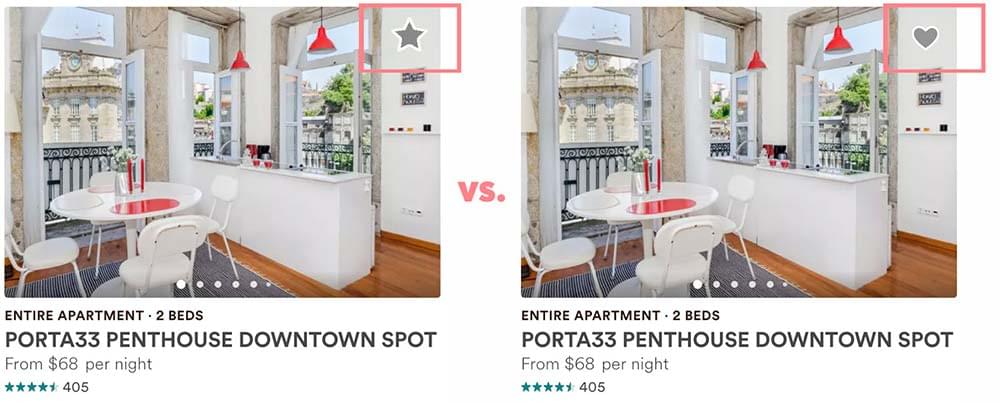
- Change the “star” saved icon to a “heart” icon.
- Use existing customer data to send users a recommendation wishlist while they’re browsing the app or desktop.
- Every time you go back to a listing more than 2 times, it’s automatically added to a wishlist.
- Create a pop-up module to notify the user to add to their wishlist if on it for more than 30 secs.
As you come up with ideas, you’ll set a hypothesis for each one. For the sake of brevity, we’ll choose the first idea to show how a hypothesis should be set.
Keep in mind, if you set a hypothesis the justification might be a little gut-feeling in the beginning if you have no data to go off of, which is why we test the hypothesis in the first place. You may even use some qualitative assumption like customer interviews to make a justification.
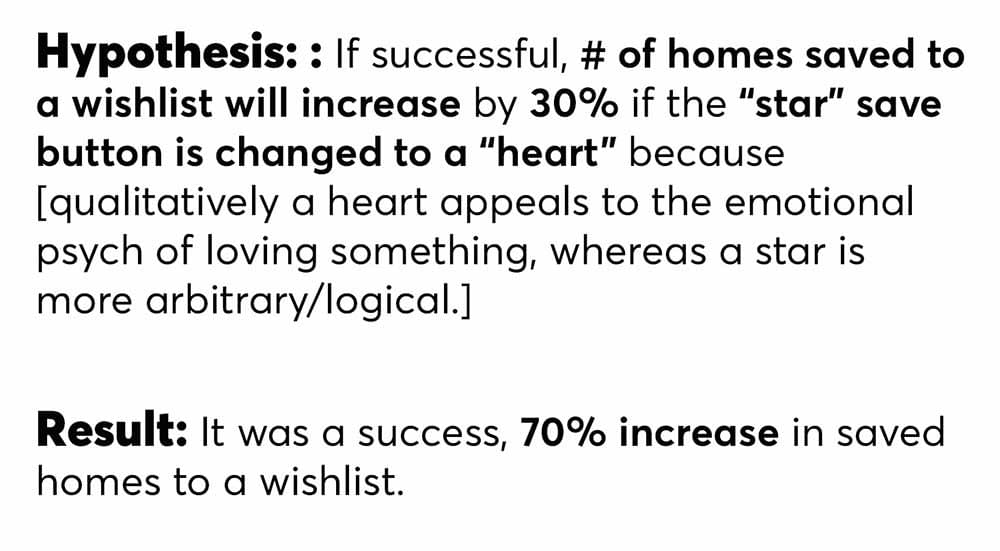
Example: If successful, # of homes added to a wishlist will increase by 30% if the “star” saved button is changed to a “heart” because qualitatively a heart appeals to the emotional psychology of loving something, whereas a star is more arbitrary/logical.
Here is a template of how to set a hypothesis: If successful, I predict [metric you’re testing] will increase by [% or units of the metric you’re testing] because [initial assumptions].
3. Prioritize
Every company has limited resources, so testing all the experiments might not be a viable option. The next step in the growth process is to prioritize which of these ideas you want to experiment with. When we prioritize ideas to experiment, we choose based on the knowledge that this is a minimally viable test, not the whole feature carried out.
Thinking if each test will work is just one part of prioritizing. We also had to determine if the test is actually worth the effort and impact and our level of confidence. For this, we can use a framework that’ll help us determine which test we should prioritize.
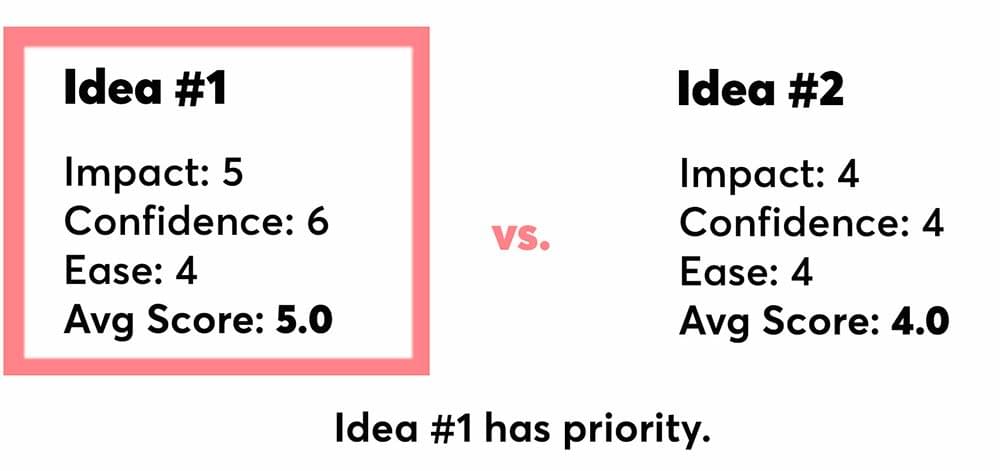
This is what I’ve learned by combining Sean Ellis and Brian Balfour’s prioritization framework. With every idea you have for an experiment, there are three decision criteria to help you prioritize: impact, confidence and effort.
We ultimately score each idea by impact, confidence, and effort from 1 -10, and take the average. Most of the time we’ll test ideas that have the highest avg score.
1. Impact or Upside: if the experiment is successful, will it impact the northstar metric?
- Figure out the reach (how many people will this experiment touch)
- Estimate the variable’s impact (probability the metric we test will impact the northstar metric)
2. Confidence: what is the probability that this experiment will be successful at moving the metric we’re testing? You can gauge this by how much domain experience you have with the particular idea.
- Score 1–3 if you it’s a completely new idea that you have barely any knowledge on.
- Score 3–5 if it’s a subject you’re somewhat familiar but still are not entirely confident.
- Score 6–10 if it’s an area you’ve experimented before or have deep domain knowledge.
3. Effort: how much time, energy, manpower, and money will it take to execute a minimal viable test? The higher the score, the easier it is to execute this experiment.
For prioritization, you don’t have to be exact; estimating the scores is fine. As you conduct more experiments, your estimates will become more accurate overtime.
Example:
Let’s score one of the wishlist ideas:
Idea #1: Changing Star icon to heart icon saved button
Impact: 8
Airbnb has a large user base, they’ll rollout this feature to 20% of the user base to test. From the growth team’s correlation analysis, they already justified that increasing # of homes saved to a wishlist per user would increase the # of nights book, so this idea will get a high upside score.
Confidence: 5
Airbnb has done many button A/B tests before, so the growth team knows that changes to the buttons don’t just offer a small marginal change on large features. However, they haven’t done many tests on this particular feature, so they’ll give this a medium score.
Ease: 8
Only two people are needed for this test to execute, the designer and an engineer. Both estimate it might take a day to complete for testing, so it’ll be on the easier end.
Avg score for this: 7.0
The growth team decides to test this experiment since it had the highest score out of all 4 ideas.
4. Experiment
The next part of the growth process is to execute, implement, and track the experiment. If you’re familiar with agile and product management, it’s essentially the same process. You’ll have growth sprints and set a cadence of a set number of experiments per sprint.
Each experiment should be designed to run for at least 1 week and make sure there is a control group (assuming there is a large enough user base). However, some experiments will run over 2 weeks — you can check out why this might happen here in this AirBnB blog post on their experimentation process.
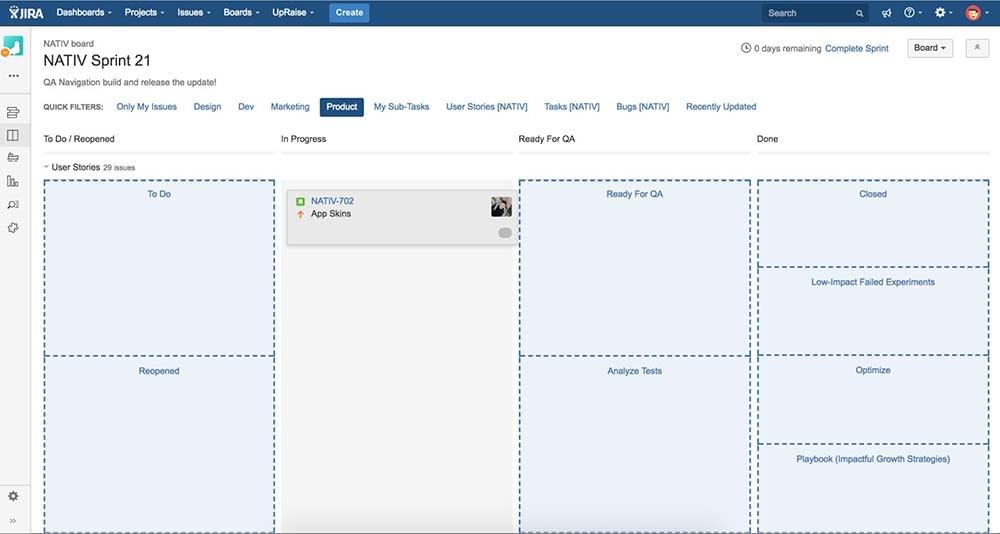
At my company, UpKeep, we set our sprints for 2 weeks and use Jira to keep track of all our experiments. We attempt to do an experiment every week because experimenting is more about getting the velocity to acquire more information of what will help you grow whether the experiments succeed or not.
Some companies could run more than 700 experiments per week. Companies figure out their experiment cadence depending on how many resources they have, how mature the company is, and if there are any other similar experiments running that might influence yours.
A good rule of thumb is to do an experiment a week per engineer you have on your team in the early stages of a company; 1 engineer = 1 test/week, 2 engineers = 2 tests/week, etc. Later stage companies can automate a lot of their experiments, which helps them scale their experiment cadence 10x.
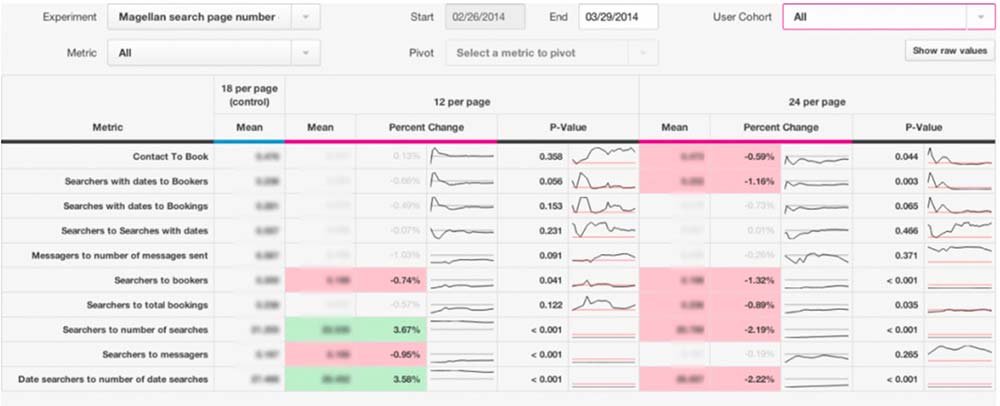
For tracking experiments, you can use Trello, Jira, Pipifey, Basecamp, etc. When a company becomes large enough, they’ll most likely create their own type of system to manage growth for extreme customization.
Airbnb’s custom dashboard:
5. Analyze
Analyzing the experiment is the most important part of the process, and documenting your analysis is what will help guide the growth in your organization moving forward. The first part of the analysis will start by looking at the hypothesis and diving into the data to see if the experiment actually moved the metric.
Looking back to our example, the Airbnb growth team ran the star-to-heart button experiment with a hypothesis that stated the experiment would increase the number of homes saved to a wishlist per user by 30 percent. After going through the analytics, the growth team sees that the number of homes saved to a wishlist had a 70 percent increase compared to the control group.
Before we call this a success, we have to see if there were any confounding issues, ask why this experiment resulted in positive movement, and what were the potential reasons for this result. After seeing what metrics were affected, we’ll see if there were any confounding issues that might have influenced the experiment. In most cases, there is at least one issue, but that’s why there’s always a discussion on the findings to sort out if the conflicts actually affected the test.
Types of confounding issues:
- If there was another experiment testing with the same user set (both the control & experimental group).
- Something such as a huge press release, holiday, etc that could have affected the results.
- Testing too many variables between the control group and experimental group of users.
- Didn’t run the test long enough to see an accurate result.
- The sample size was too small. For smaller stage companies, you should work on growing the number of users and retain them to start experimenting.
In our Airbnb example, the growth team discovered that there was a press release that was launched the same time but determined that it didn’t affect the experiment.
Now, we can call the experiment a success and start discussing why we think there was such a huge lift in the # of homes saved to a wishlist. The discussion will probably also investigate why there was a huge discrepancy compared to the hypothesis as well.
We’re not done just yet, the final part of the growth process is to systemize. After the test has been determined a success or failure, you communicate the next steps when you log the results into your project management system.
If successful:
a. Determine how to double-down on this experiment (do you release it to the whole user base, or conduct the same experiment with a larger sample size?)
b. See if this experiment provides more insight to other experiments and then readjust ICE scores for other tickets to prioritize other ideas. Also, does this offer insight on other behaviors or funnels for other parts of the product?
c. Move to playbook.
If it failed:
a. Indicate learnings on how to run this test next time with another hypothesis.
b. See if this experiment provides more insight into other experiments and then readjust ICE scores for other tickets to prioritize other ideas. Also does this offer insight into other behaviors or funnels for other parts of the product?
c. Move to Failed Experiments: For the Airbnb example, we’ll wait to see if the increase in # of homes saved to a wishlist does positively impacts the # of nights booked as we collect more data throughout the next few months.
The last step is to repeat this process over and over again.
This was an overview of how to run effective growth experiments and at first, it can be a little tedious but it has massive payoffs as you continue to test. You’ll have more failures than successes, but with every failure is an opportunity to learn more about your product and how people use it. More tests = more learning.
The Airbnb example was actually a real test they did back in 2011, you can read more about that test in this co.design article.
If you have any insight, questions, or feedback, feel free to reach out. I’m always trying to learn better ways to conduct growth experiments myself.
Fun fact: For my paper towel experiment, Brawny turned out to be the better brand.
Arjun Patel is a Growth Marketing Manager for UpKeep Maintenance Management. Arjun has been a founder and CEO of previously funded startup and is now helping change the way maintenance teams streamline their workflow by running growth initiatives at UpKeep. UpKeep is asset and maintenance management — done the right way. We take a mobile-first approach to the traditional desktop-based enterprise software. We keep technicians out in the field working on the most pressing issues — saving valuable time and money. Tracking the costs of assets over their lifetime is now easier than ever. We keep businesses more efficient and streamline their workflow by eliminating paper work orders.
Get our best stuff.
